


There are a few ways to reduce household leverage: 1) keep liabilities growing more slowly than income, 2) transfer part of private debt to the government, 3) not pay (default) and/or 4) cut consumption sharply (raise saving, in the macroeconomic sense).
We argue here that an exit implying a substantial burden on the public sector will not be feasible, and that the slowdown in real wage-bill growth is likely to deepen in 2027.
The reversal of the downward trend in unemployment, the rise in inflation expected for next year (constraining any credible monetary-policy easing), low confidence in the private sector and further tightening of credit-granting standards suggest that a relevant part of the adjustment will come through a combination of higher default and contracting consumption.
This combination is consistent with a stagflation scenario.
“Good” Debt and “Bad” Debt
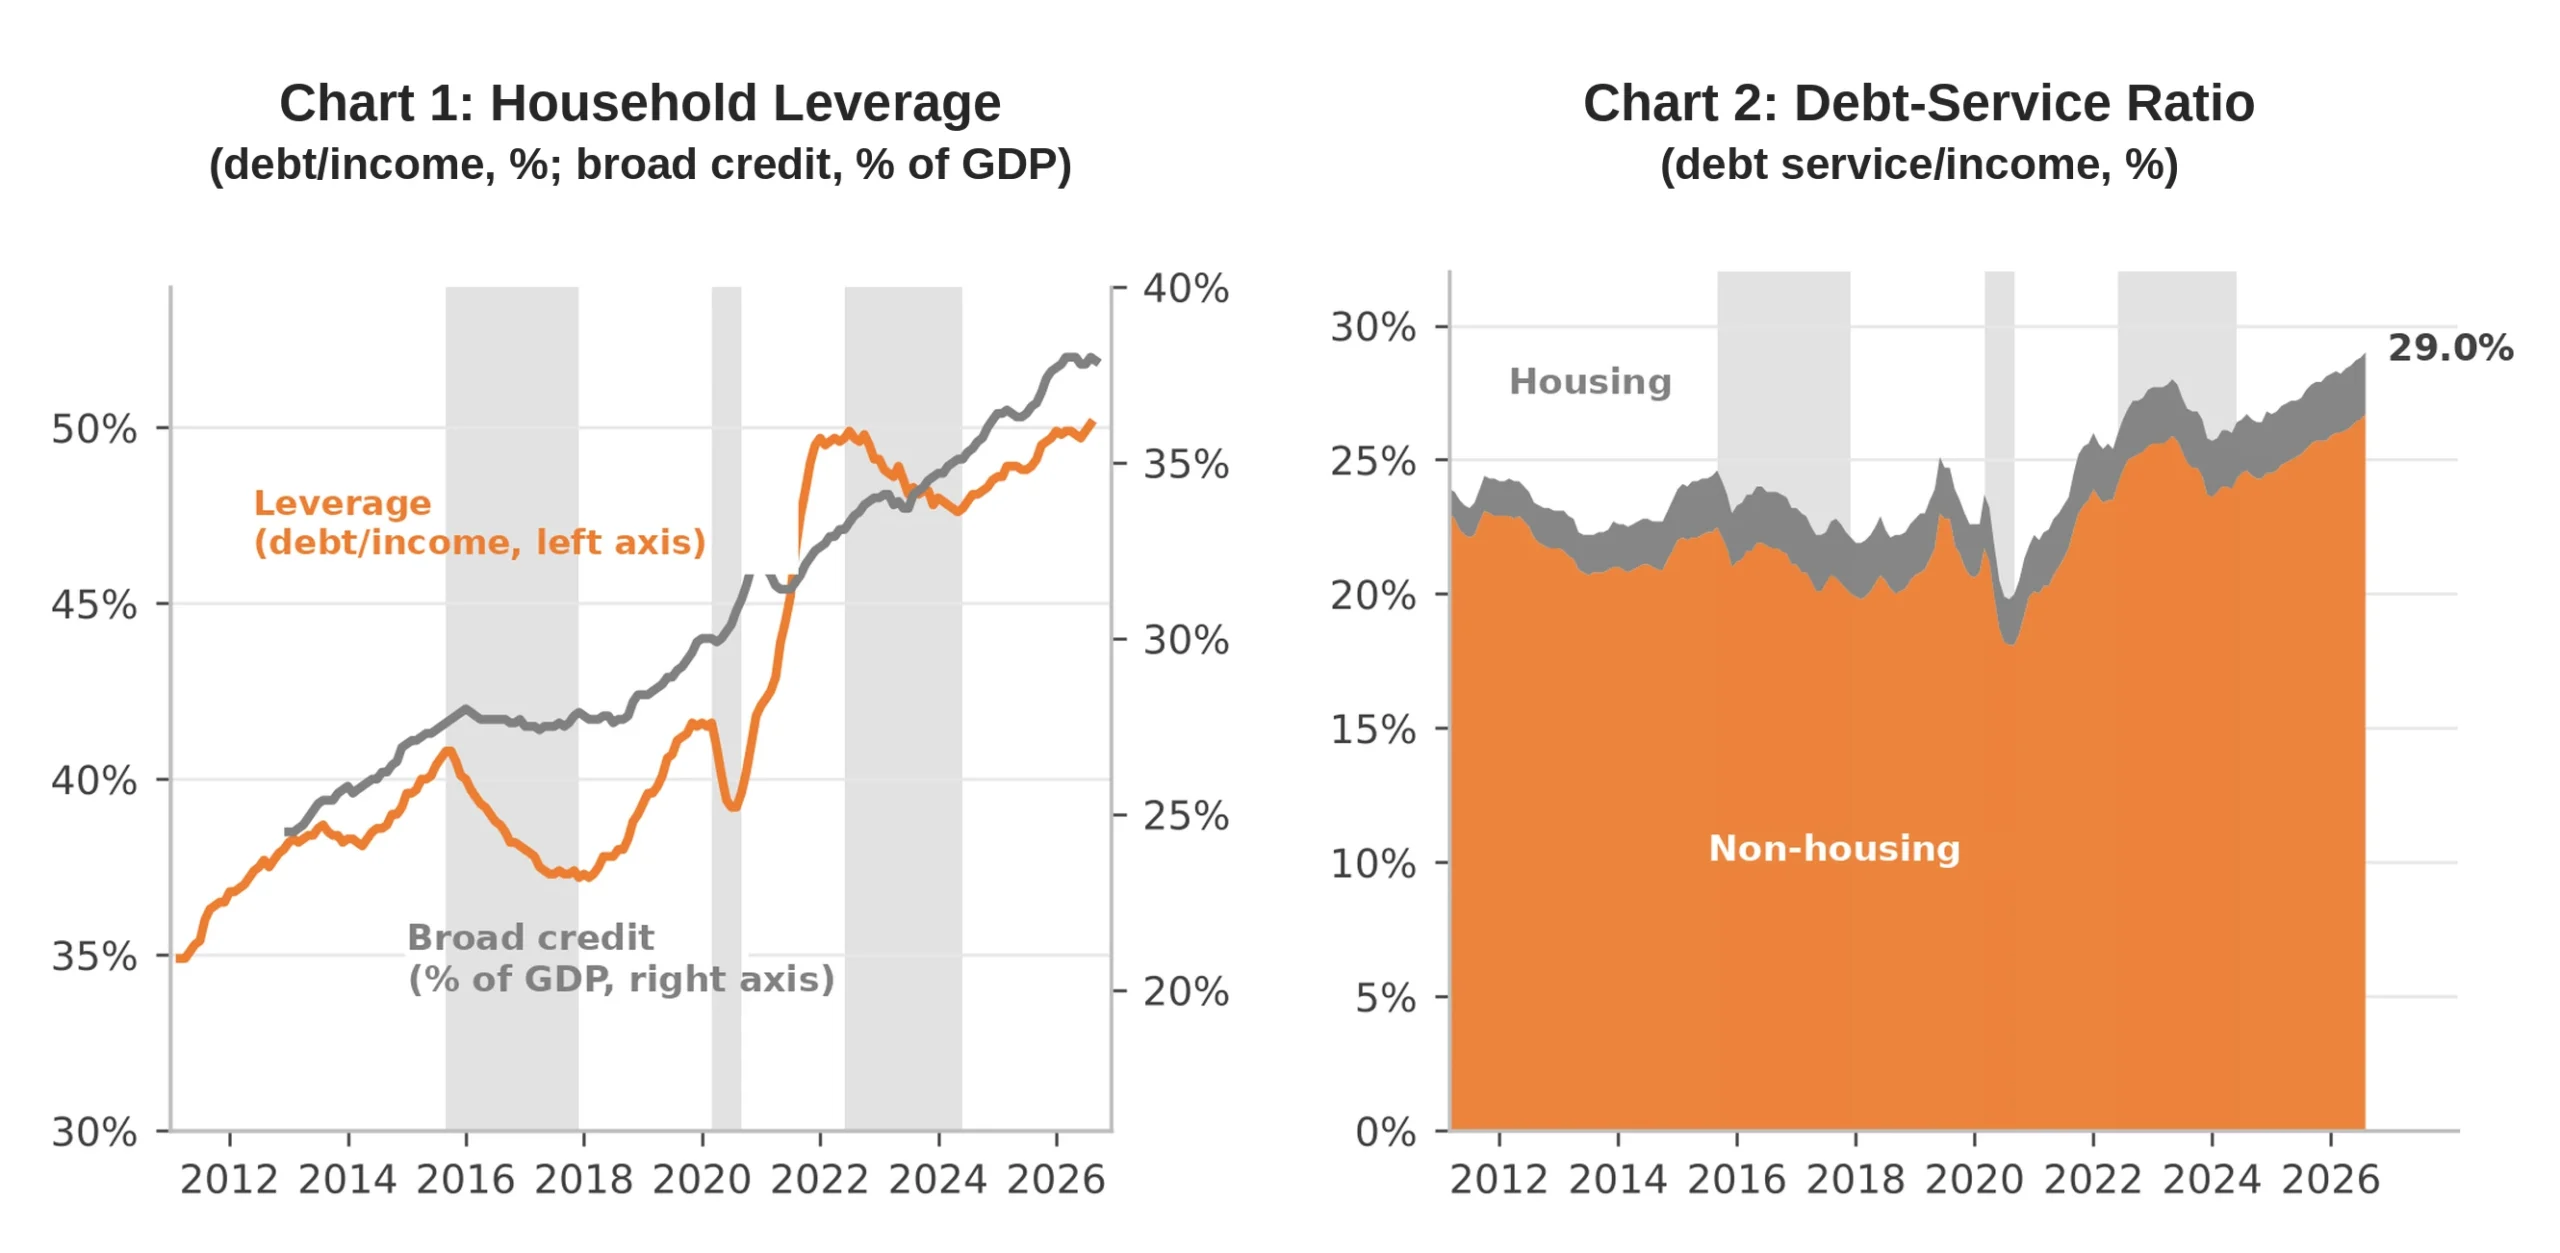
Household leverage, measured as the ratio of debt to the financial system to income accumulated over twelve months, reached 50.1% in August 2026 (the latest data available), the highest reading in the Banco Central’s series, which began in 2011. Measured by broad credit to households as a share of GDP, debt reached 37.9% in September, against 24.5% in January 2013 (Chart 1).
Early in the decade, the debt cycle appears to have unfolded in a healthy way, with low interest rates and expanding income. The reopening of the economy (after the Covid tragedy) and wider access to credit through digital and payroll-deducted channels favored a virtuous cycle in which rising liabilities had a moderate impact on households’ debt-service ratio and saving position, despite the ongoing normalization of monetary policy.
The problem is that the formula seems to have run its course between late 2023 and early 2024. Fiscal expansion forced the monetary authority to reverse the cuts in the policy rate, while consumption remained sustained by employment growth (which was already reaching its limits) and by new debt (rolling over toward more expensive, shorter-term forms of credit).
In other words, if at first the borrowing seemed to be matched by genuine income gains and wealth creation (assets), in a second phase it appears to have rested mainly on an unrealistic expectation about the sustainability of the macroeconomic model.
Deleveraging
The literature treats household deleveraging as a balance-sheet adjustment with effects on demand. Some debtors cut spending all at once and will only be offset by savers if the real interest rate falls. If borrowing costs stay high, the adjustment comes through a fall in output. The credit squeeze leads part of society to pay down its liabilities (or some of them) while another part raises its precautionary saving (with a larger effect on durable goods). Along the way, asset sales and debt foreclosures tend to push asset prices down.
Brazil’s recent history shows three periods in which leverage and the debt-service ratio fell, even if moderately (they are shaded in the charts). The episode that looks most similar to the current one is 2015/2016: 1) high inflation and interest rates, 2) the prospect of a sharp slowdown in income and 3) rising default.
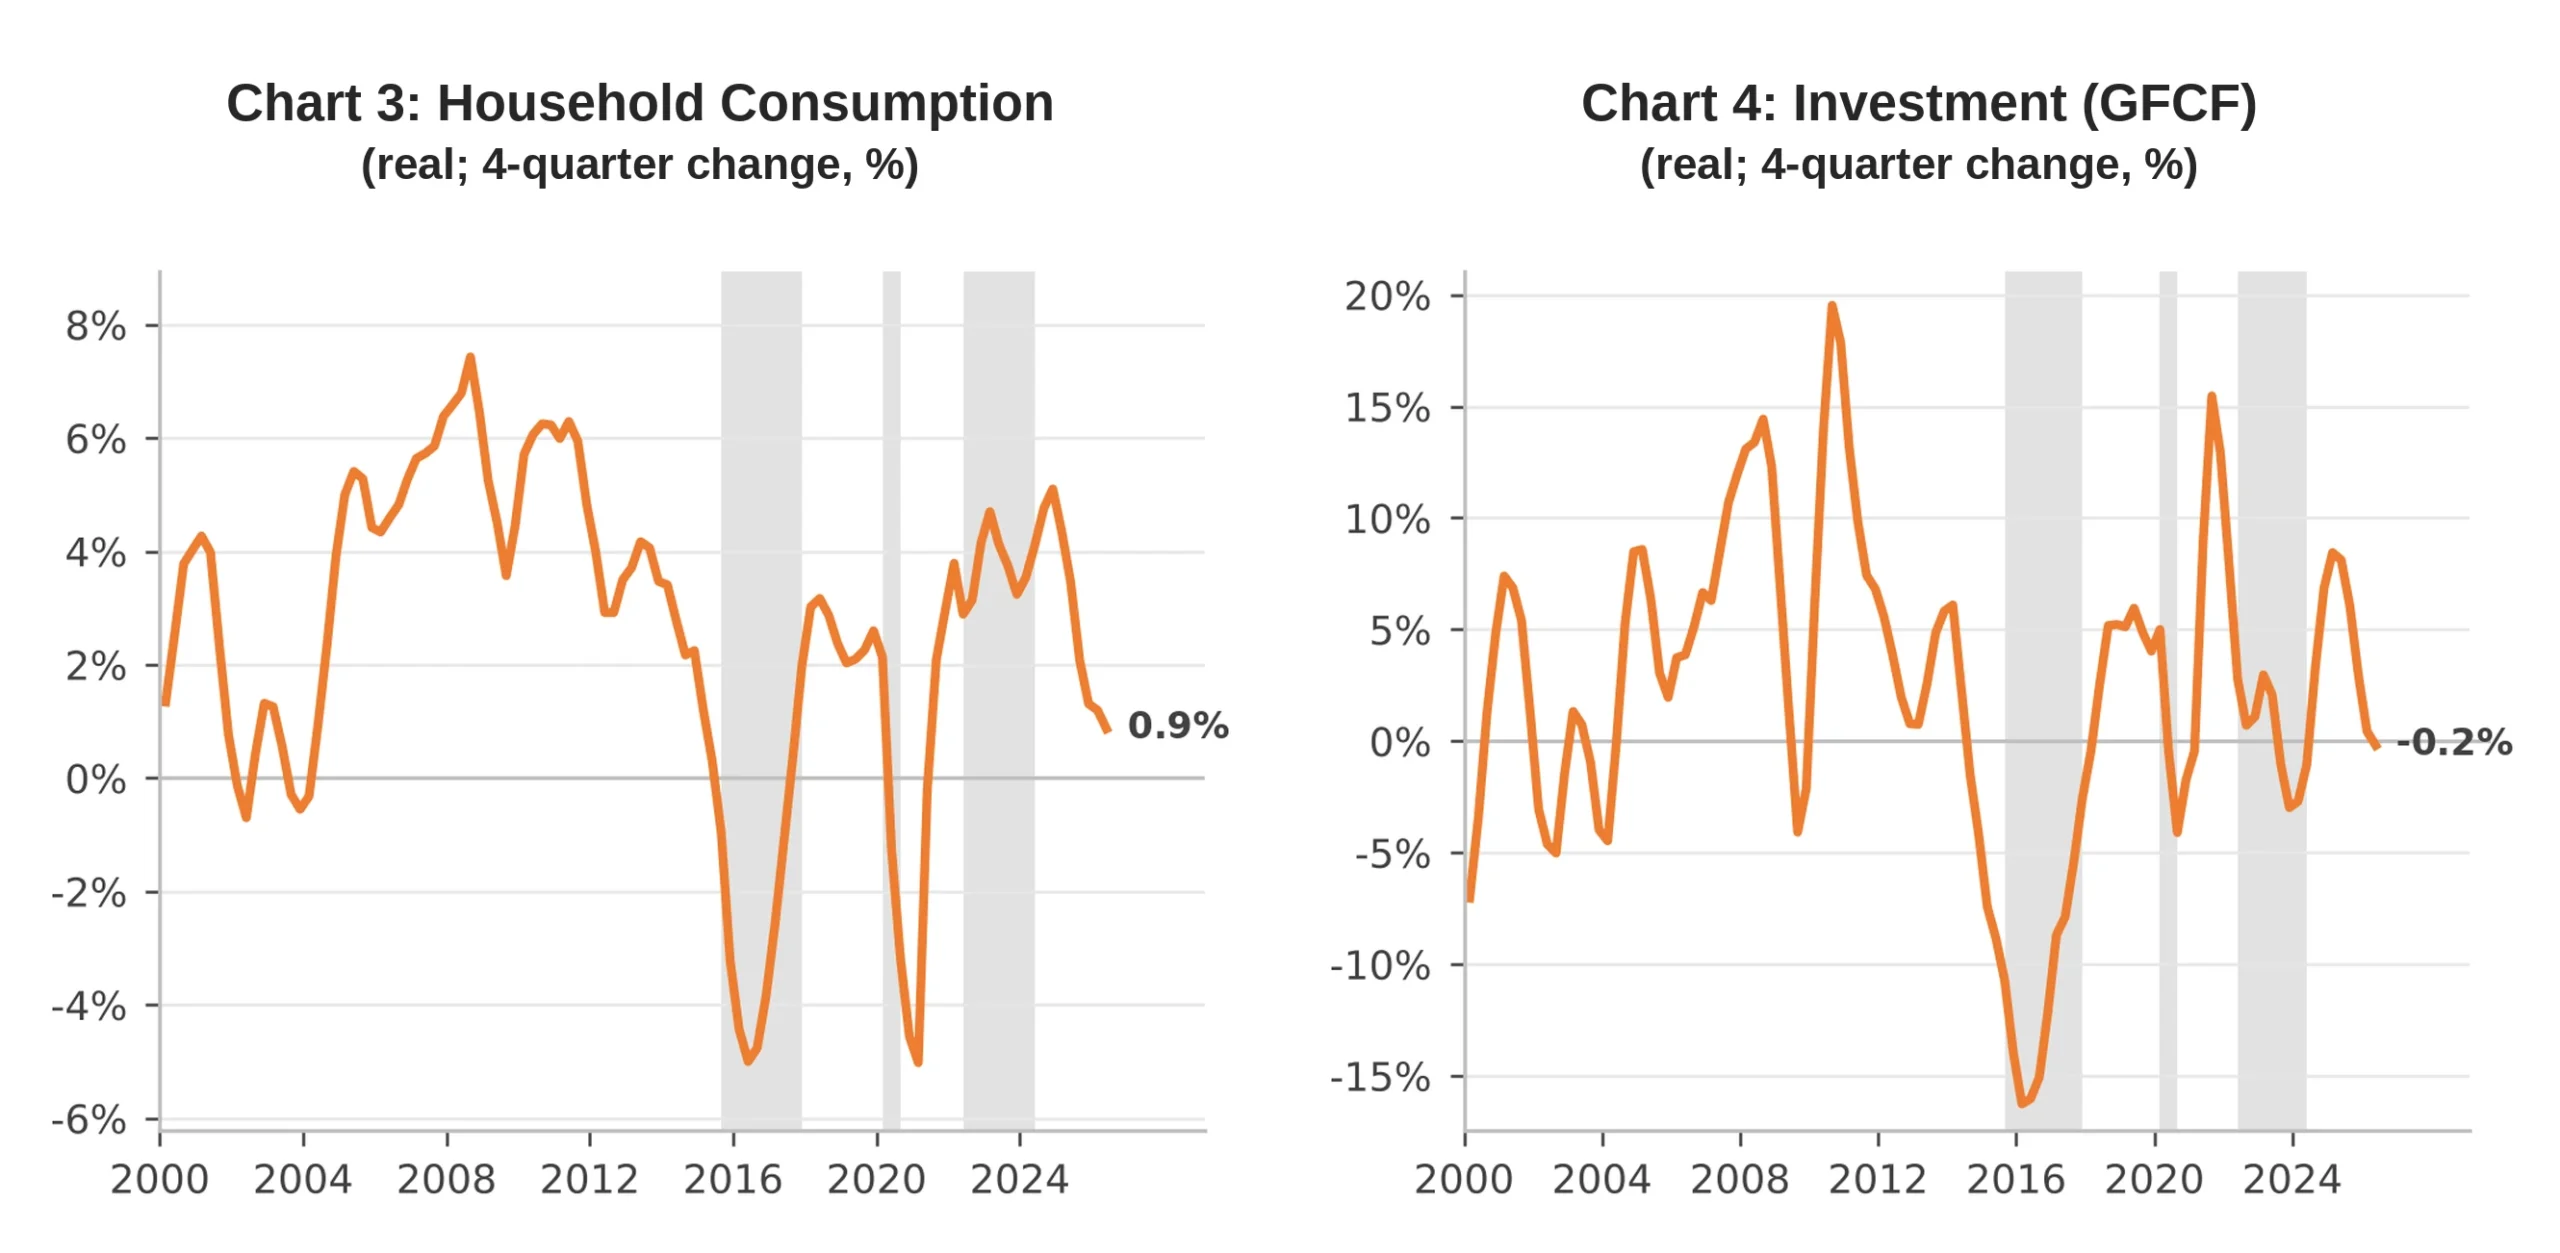
What one expects in a deleveraging period is a slowdown in consumption and investment. Charts 3 and 4 show the four-quarter change against the previous four quarters since 2000, with the deleveraging periods shaded. In the 2015–2017 episode, household consumption went from a 3.4% rise in the first quarter of 2014 to a 5.0% drop in the second quarter of 2016, and investment (gross fixed capital formation) fell as much as 16.3% in the first quarter of 2016. In 2020, consumption fell 5.0% through the first quarter of 2021 and investment 4.1% through the third quarter of 2020, because of the pandemic.
In the 2022–2024 period the response was much milder, and it must be said: consumption stayed up between 2.9% and 4.8% and investment fell 3.0% in the fourth quarter of 2023, returning to 3.3% growth in the third quarter of 2024. Deleveraging was moderate; the labor market and transfers sustained income. What determines the intensity is the combination of three factors: the prior rise in leverage, unemployment and the economy’s capacity to grow income. In 2015 and 2016 all three worsened together.
The current situation already shows the start of this movement, with leverage still at its peak. Real consumption decelerated from 5.1% in the fourth quarter of 2024 to 0.9% in the second quarter of 2026, and investment from 8.5% in the first quarter of 2025 to a 0.2% decline. The risk is the vicious circle: a slower economy, higher unemployment, lower income, a higher debt-service ratio and default, and an even larger adjustment. The government will also have to adjust, with gross debt at 82.9% of GDP and high real interest rates, and this rules out the fiscal stimulus that cushioned 2020. The cycle therefore tends to be worse.
Don’t Confuse Leverage with Dissaving
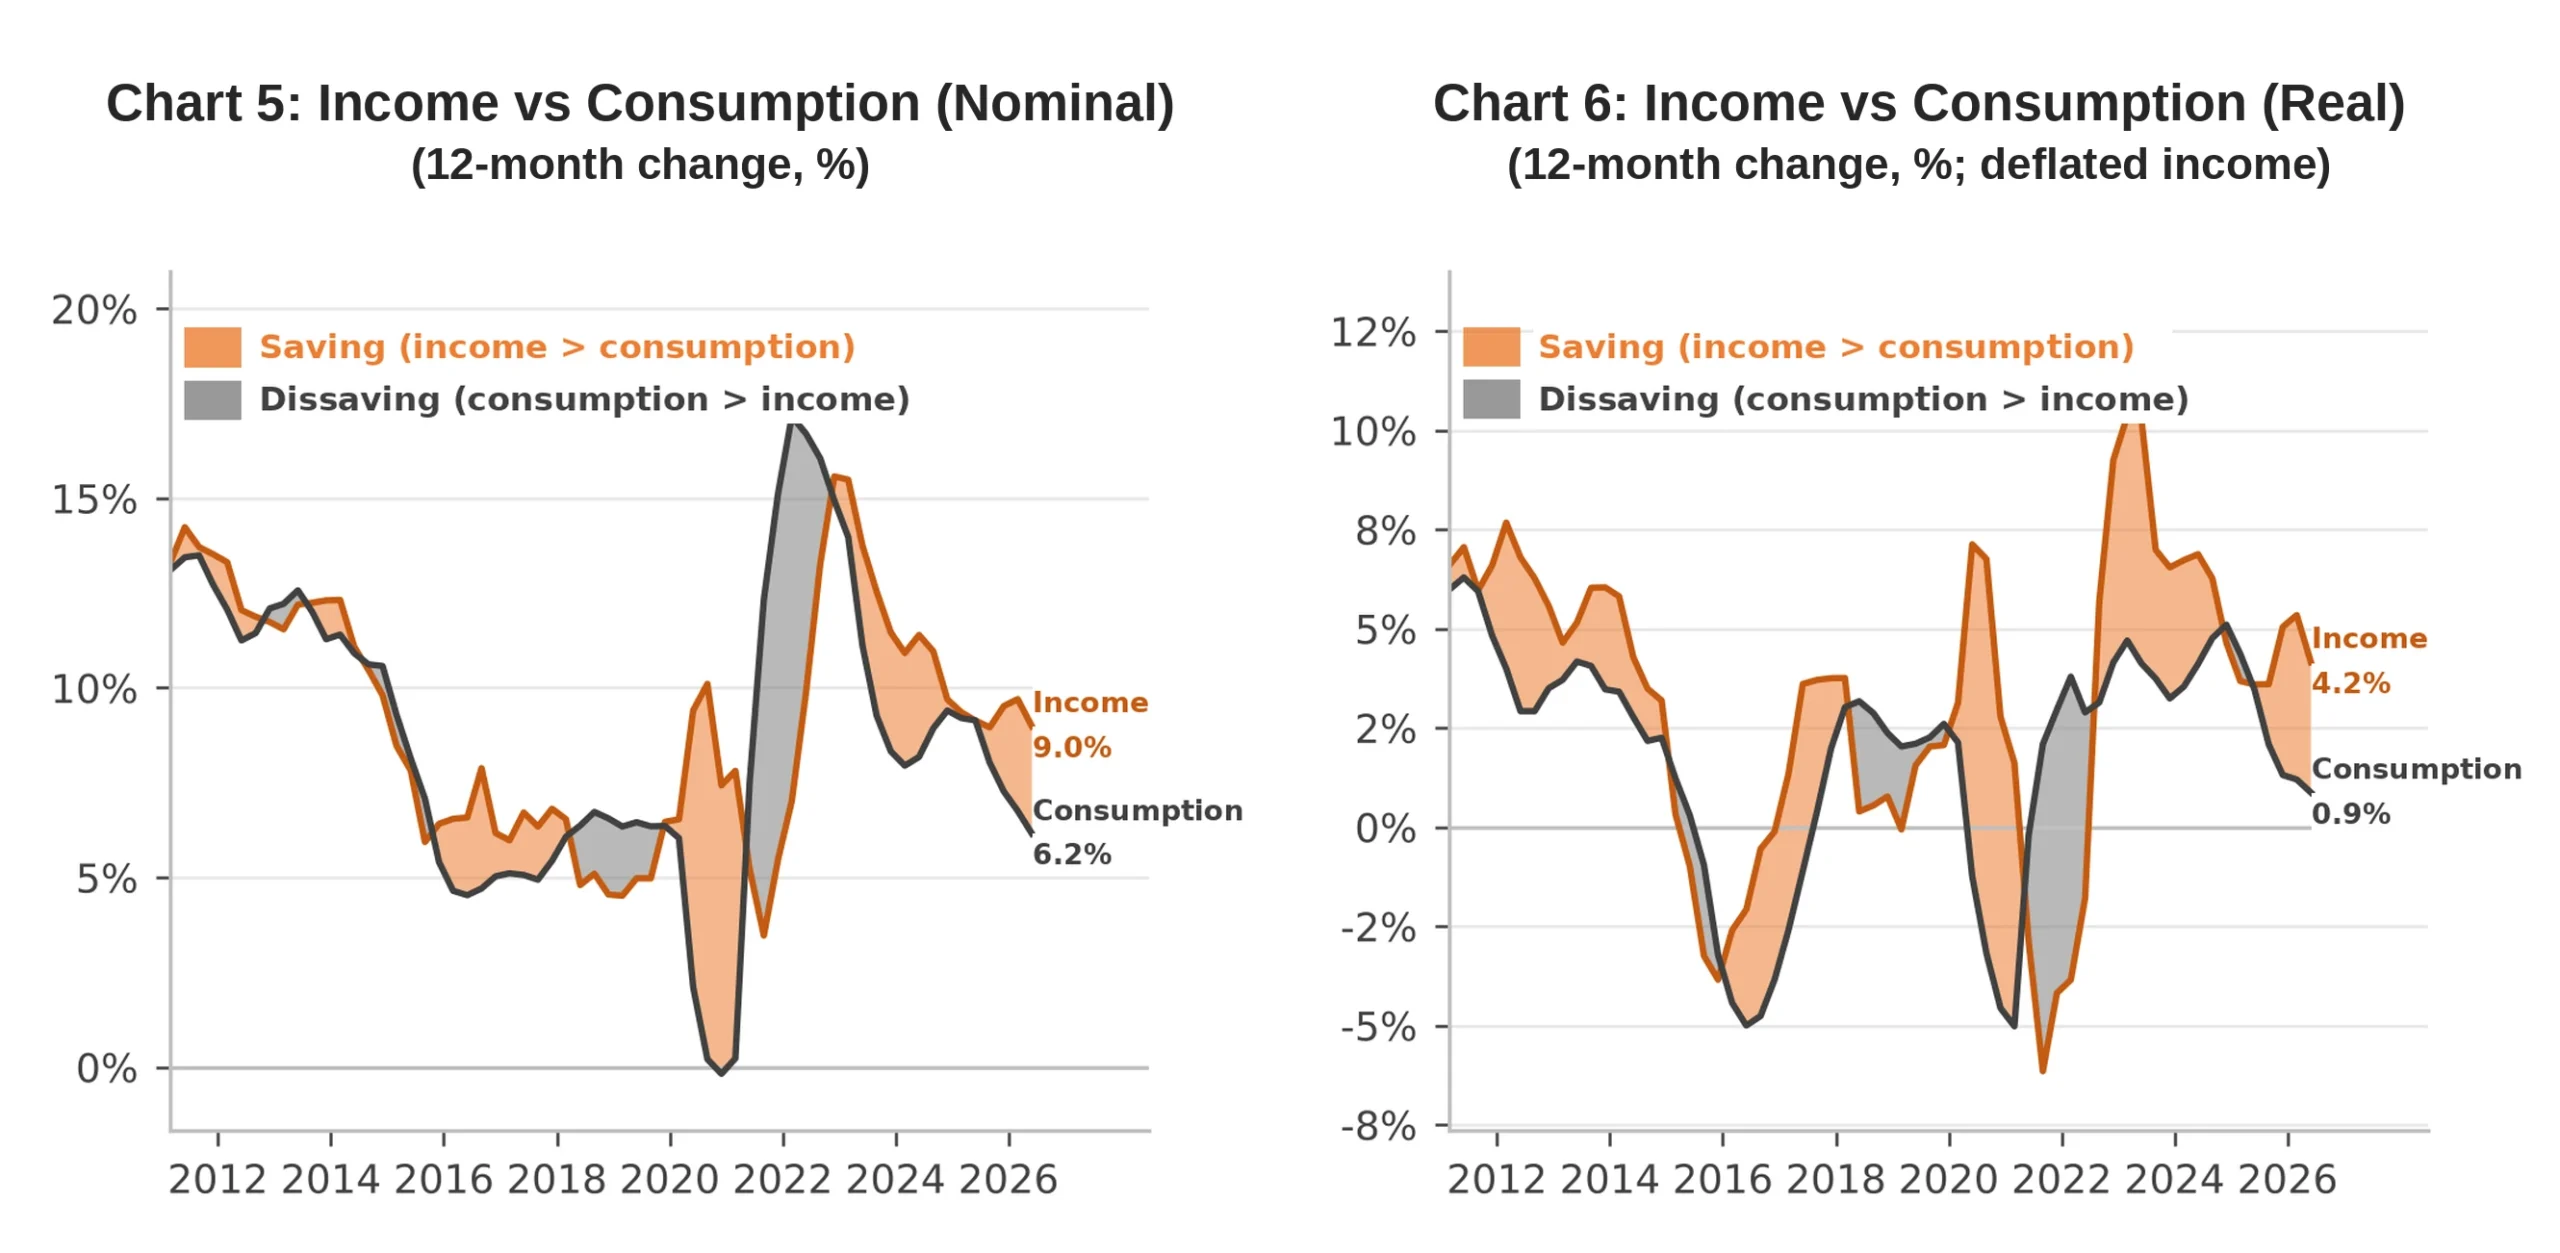
Saving, in the macroeconomic sense, is the difference between income and consumption. See Charts 5 and 6. When income grows faster than consumption, saving rises (orange); when consumption grows faster than income, saving falls (dissaving (gray)).
Consumption does not always have to give way for deleveraging to occur. In an environment of expanding income it is perfectly possible to keep some pace of spending growth and still meet financial obligations. Leverage falls if new credit grows less than income. The difficulty lies in deleveraging when 1) the mass of earnings (income and employment) does not hold up and/or 2) interest rates do not come down.
This appears to be the current situation. The Banco Central has no room to ease monetary policy. Twelve-month IPCA reached 4.6% in September 2026, well above the 3% target, and the tendency is for it to move even further away over the coming months because of: exchange-rate depreciation, the impact of the tax reform, the effects of ending the 6×1 work schedule and a possible reinstatement of fuel taxes.
Toward the Deleveraging-and-Saving Quadrant
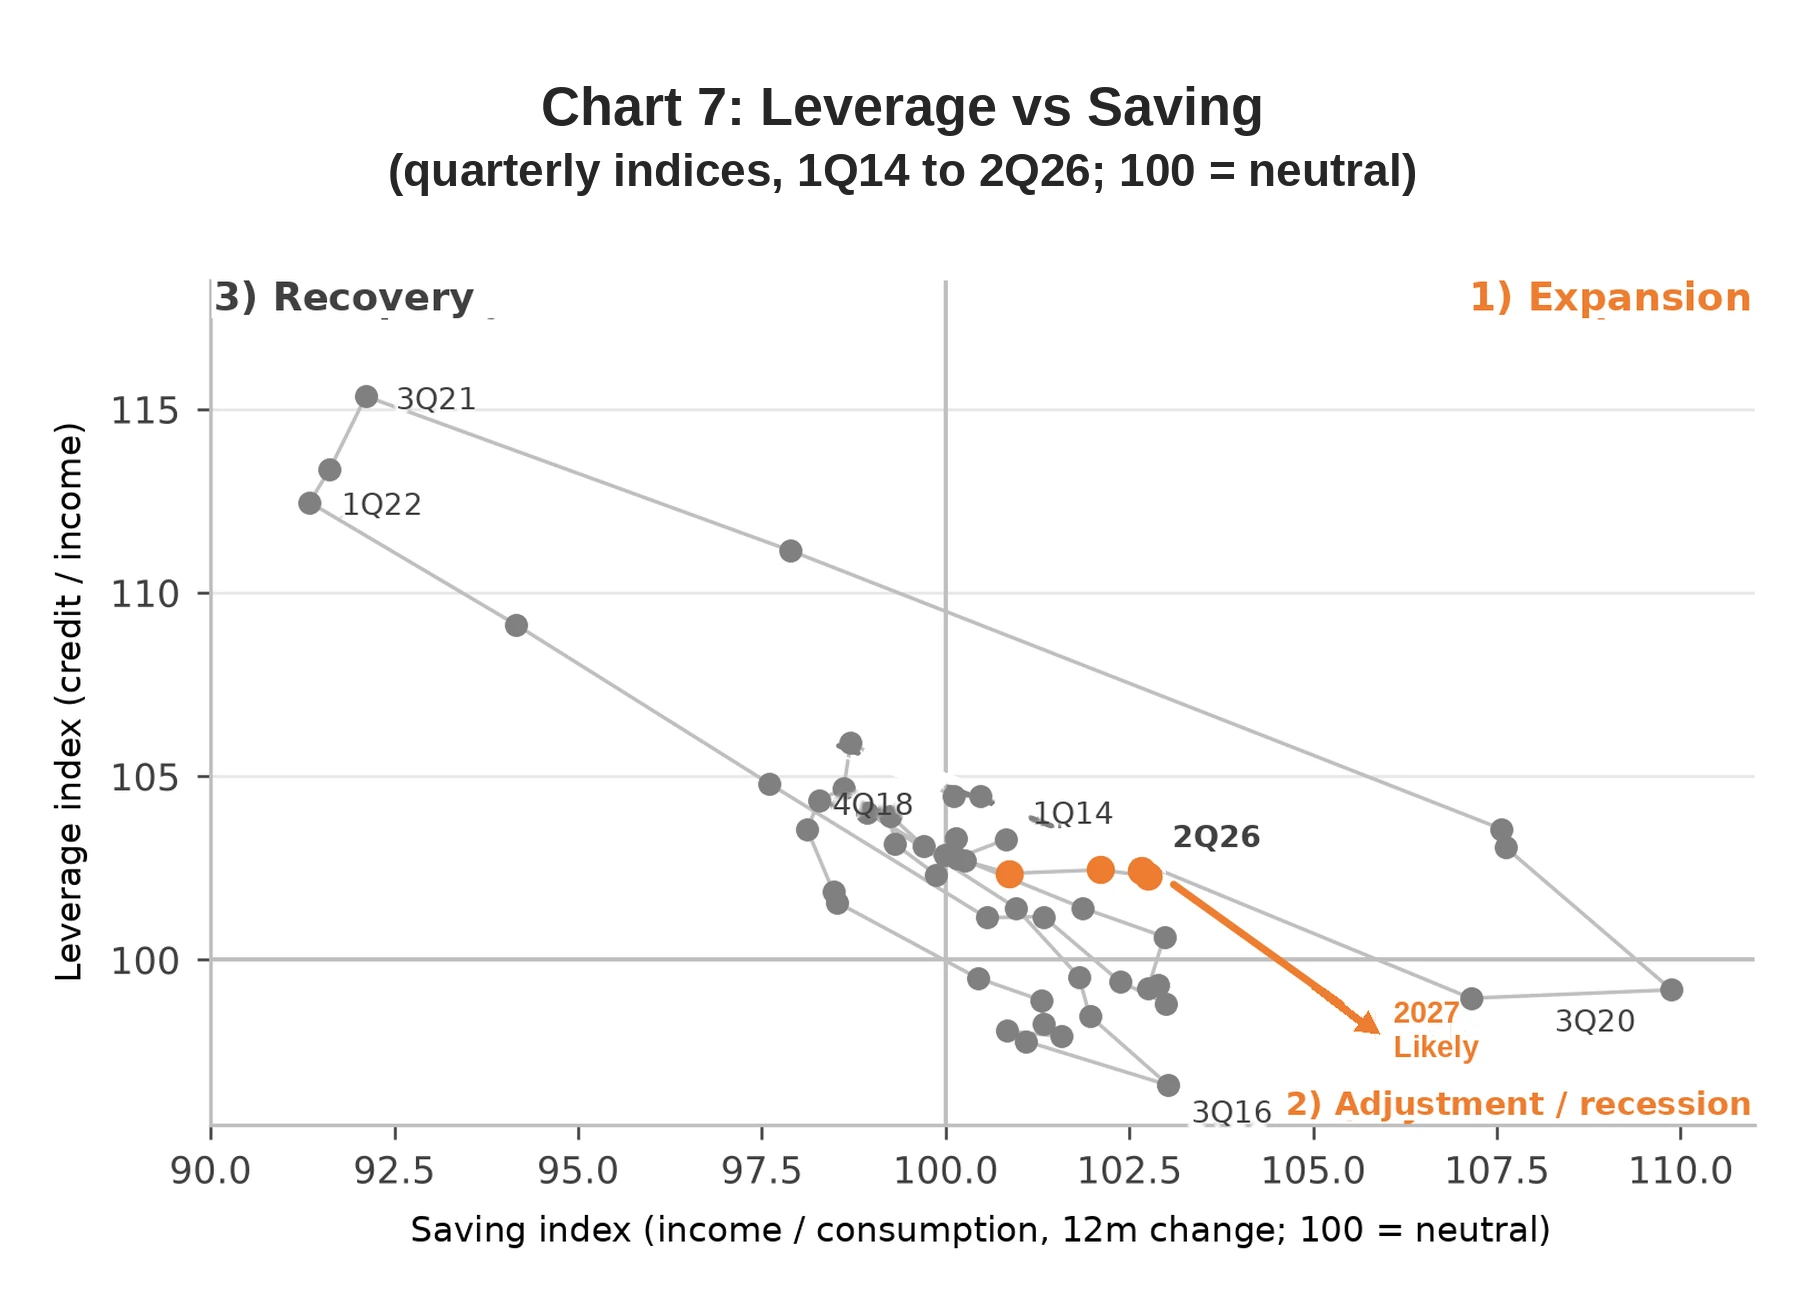
To track the pace of the adjustment, we created two indices. The leverage-change index is the ratio between the twelve-month change in broad household credit and the twelve-month change in income: above 100, credit grows faster than income and leverage (debt/income) rises; below 100, there is deleveraging. The saving index is the ratio between the twelve-month change in income and that in consumption, both nominal: above 100, saving rises; below 100, it falls (dissaving).
Chart 7 combines the two indices, quarter by quarter since 2014, and describes the phases of the cycle. In quadrant 1 (top right), leverage and saving both rise: households borrow with a counterpart in assets — financial, real estate or other — and, if assets appreciate more than the cost of debt, the cycle is virtuous. Prices rise, activity grows, confidence increases and there is room for consumption and saving at the same time. It may be sustainable, in a normal GDP-growth cycle, or not, in a bubble. This is the expansion phase.
The problem is when the cycle hits its limits: high inflation, high interest rates, high default and an adjustment in asset prices. Risk aversion and uncertainty rise, and credit supply becomes more limited. This is quadrant 2 (bottom right): leverage falls, but saving still rises, because income decelerates sharply and consumption decelerates even more. This is the recession-and-adjustment cycle. Quadrant 3 (top left) is the recovery: saving has already adjusted, default is under control, and lenders and households return to credit, with consumption growing faster than income on the back of confidence.
The question is: where are we headed? We believe we are heading to quadrant 2, for several reasons. 1) The strong increase in credit in the prior period, 2) rising inflation (making a substantial cut in interest rates difficult), 3) contractionary fiscal policy and 4) elevated distrust toward the economy and toward defaulters.